
What can we expect in the financial markets in 2026!
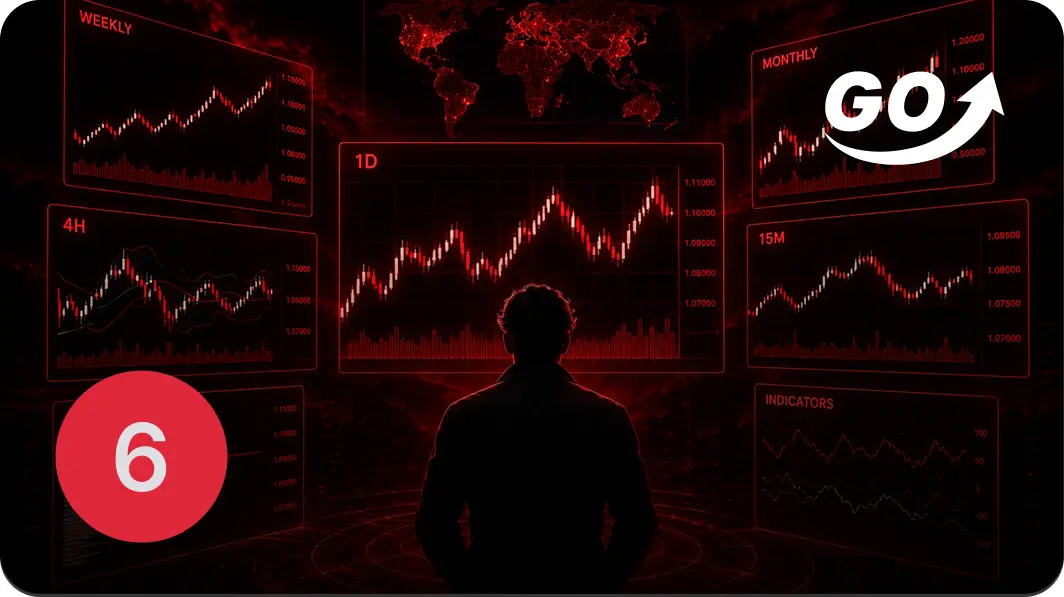
Time Frames: How Can We Avoid Losing Sight of the Bigger Picture?
Time frames define how long a period a single candlestick represents on your chart. Beginners often make the mistake of focusing on only one time frame—such as a five-minute chart—and completely ignoring the broader context.
However, technical analysis is based on the principle that patterns repeat across all time frames. A professional approach requires a top-down analysis. You start with a daily or weekly chart, where you identify the main trend and strong support and resistance levels. These levels carry much more weight for the market than those you’ll see on minute-by-minute candlesticks.
After identifying the main direction, you move to lower time frames—such as the four-hour or hourly chart—to find specific trading setups and fine-tune your entry. This approach allows you to see the details without losing sight of the big picture. If you see a buy signal on a five-minute chart, but the daily chart is in a strong downtrend and is currently hitting strong resistance, the probability of your buy trade succeeding is low.
Multidimensional analysis of time frames is key to understanding when market movements are merely insignificant corrections and when they mark the true beginning of a new trend. The ability to switch between different perspectives and look for consistency among them is what distinguishes profitable traders from those who get caught in short-term price traps.
Navigation in the guide
Feel free to contact us
Feel free to send us any request. Our support team is available 5 days a week.
.svg)
+357 25 010426 (Mon–Fri 8:30–17:00)
.svg)
We will contact you shortly.
Risk warning: CFDs are complex instruments and come with a high risk of losing money rapidly due to leverage. 74.25% of retail investor accounts lose money when trading CFDs with this provider. You should consider whether you understand how CFDs work and whether you can afford to take the high risk of losing your money.