
What can we expect in the financial markets in 2026!
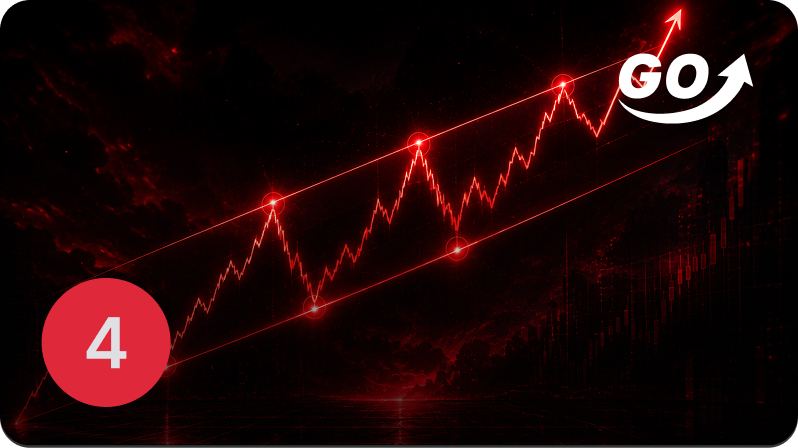
Trend Channels: How to Track Price Movement?
While horizontal support and resistance levels show us static zones of interest, trend lines help us track price dynamics as they move. A trend line in an uptrend is drawn by connecting at least two, and ideally three, consecutive higher lows.
This sloping line then serves as a sloping floor from which the price bounces upward on its retracements. If we add a parallel line connecting the peaks to this line, we create a trend channel. Price movement within the channel provides us with a clear visual boundary for our trading and shows us not only the direction but also the speed and stability of the current trend.
A breakout of a trend line is one of the most significant technical signals. It means that the angle of the uptrend or downtrend has changed and the market is likely losing its previous momentum. However, it is important to determine whether this is a genuine breakout accompanied by high trading volume or merely a false breakout, after which the price will return to the original channel.
Trend lines are an extremely subjective tool, so it is crucial to draw them conservatively and connect only those points that are clearly significant to the market. A correctly drawn trend channel will not only allow you to buy at the lower boundary during an uptrend, but also to identify in a timely manner points where the market is already overbought and at risk of a correction toward the centerline or the opposite side of the channel.
Navigation in the guide
Feel free to contact us
Feel free to send us any request. Our support team is available 5 days a week.
.svg)
+357 25 010426 (Mon–Fri 8:30–17:00)
.svg)
We will contact you shortly.
Risk warning: CFDs are complex instruments and come with a high risk of losing money rapidly due to leverage. 74.25% of retail investor accounts lose money when trading CFDs with this provider. You should consider whether you understand how CFDs work and whether you can afford to take the high risk of losing your money.